Orthogonal Frequency Division Multiple Access

Frequency and time graphs in OFDM and OFDMA.

Frequency and time graphs in OFDM and OFDMA.
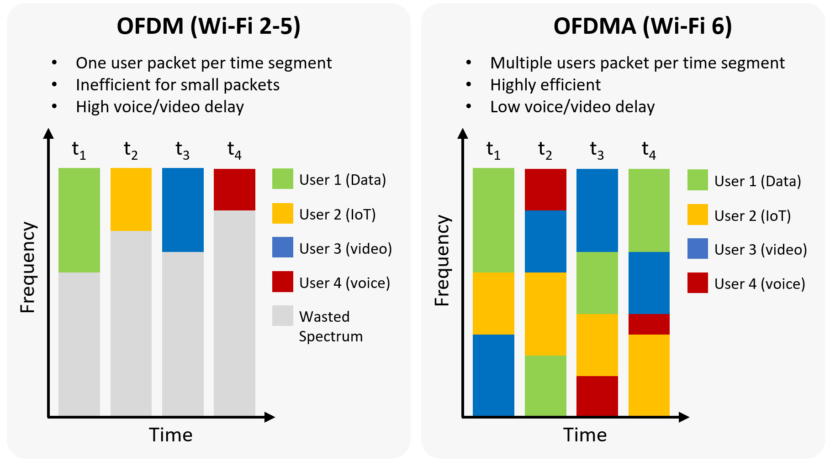
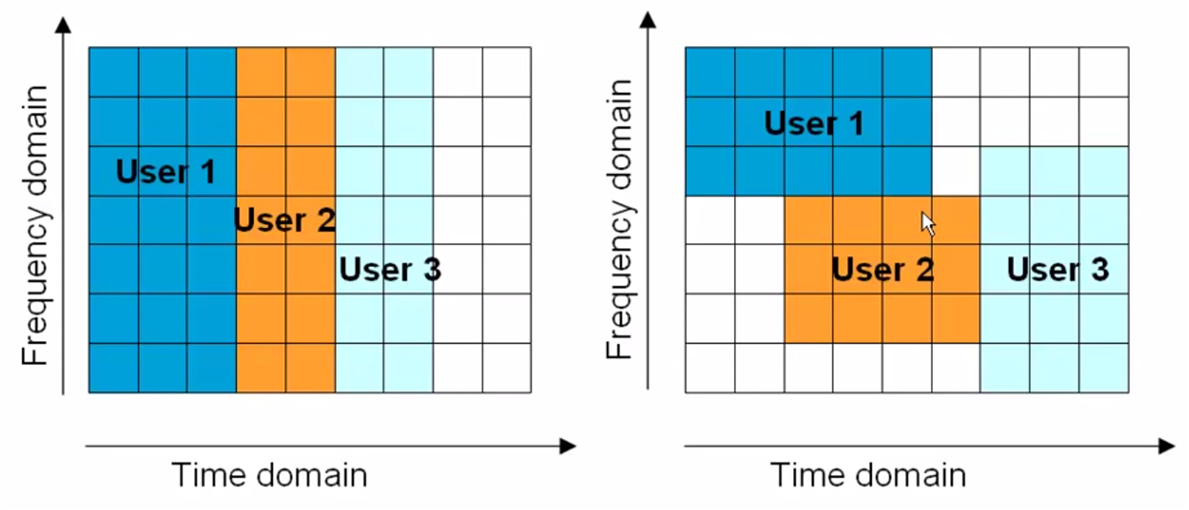
OFDM splits the spectrum into 15kHz sub-channels but allocates the whole channel to a single user for the specified time interval. This leads to wasted bandwidth. What if the channel could be shared between different users over a single timeslots. This is OFDMA.
The diagram clearly shows the potential space causes by a single user allocated to a channel through a time slot. But if multiple access is allowed then this space is used for another user. Obvioulsy different user types have different data demands and the diagram clearly shows this. (Note OFDMA us used in WiFGi6 as well as LTE+ / 5G)
In LTE+ there is a maximum of 2048 sub-channels each of 15kHz which works out another 30MHz - limiting the maximum channel size to this value. But the standard for LYTE+ sub-channels are 1.4, 3, 5, 10, 15, and 20 MHz.
In 5G-NR OFDM is used in both the downlink and uplink use OFDM with the fixed sub-carrier size of 15, 30, 60, 120, 240, or 480kHz with up 3300 sub carriers. This is a maximum of 1500MHz, (simple arithmetic) but the operators do not have this space but they are arguing for continguous space of 100MHz to run their 5G-NR.
In the downlink, the subcarriers are split into resource blocks. This enables the system to be able to compartmentalise the data across standard numbers of subcarriers. Resource blocks comprise 12 subcarriers, regardless of the overall LTE signal bandwidth. They also cover one slot in the time frame. This means that different LTE signal bandwidths will have different numbers of resource blocks. Different users will have different demands for their data but these are allocated in rectangular blocks.
© mobilephonetechnology.co.uk all rights reserved 2017-2025
